


About the Climate Tech Landscape
The Global Climate Tech Landscape 1.0 is an open-source taxonomy for climate innovation, providing a common structure and language for identifying, tracking and making sense of the breadth and depth of innovation happening in climate technology globally. The purpose of the Global Climate Tech Landscape is to create a granular and global open-source framework to enable insights such as:
- Where are we seeing solutions and innovation? What is the velocity of formation, funding and growth? How is this changing over time?
- Where are the gaps? When compared to the challenges we are facing, which areas are under-weight or white-space?
- Where are we seeing traction and momentum? Where might new science and technology find a commercial market to apply new novel innovations and achieve self-sustainability?
Licensed under Creative Commons and as an open source project, the taxonomy is available for anyone to support their own work in climate innovation, to identify an area of focus, or to locate their organization and their peers on the landscape.
A global community of energy, environmental and infrastructure innovators can track and contribute to the taxonomy’s ongoing development. Following an agile approach, suggestions, ideas and iterations on enhancements will be open and available, where anyone can contribute, share ideas or transparently trace each step of the landscape's evolution. Join us on Notion to keep updating the Global Climate Landscape.
Methodology
The Global Climate Tech Landscape embraces two classical approaches to data, analytics and design. ‘Bottom Up’ analysis powered by HolonIQ’s Impact Intelligence Platform leveraging powerful machine learning and artificial intelligence, augmenting ‘Top Down’ analysis driven by a global network of experts across all Climate Tech domains.
Bottom Up - Machine Learning
To build the taxonomy, we undertook a ‘bottom-up’ analysis using HolonIQ’s proprietary machine learning and artificial intelligence engines to analyze tens of thousands of Energy, Environmental and Infrastructure organizations worldwide, including all Climate Tech 1000 applicants and nominees.
The self organizing map to the right started the process by looking for patterns in the data to establish natural segments, un-constrained by a traditional or conventional perspective. This step focuses on the boundaries between different segments and defining potential categories and segments that a human expert can investigate and qualify.
The ‘alpha’ prototype landscape below was an initial hypothesis and concept network map of several thousand Climate Tech companies from around the world. While the Climate Tech 1000 process was receiving applications and nominations, the ‘alpha’ was being stress-tested with leading scientists, governments and institutions, universities and technology companies around the world; informing the ‘beta’ with smarter and deeper insights into the landscape.
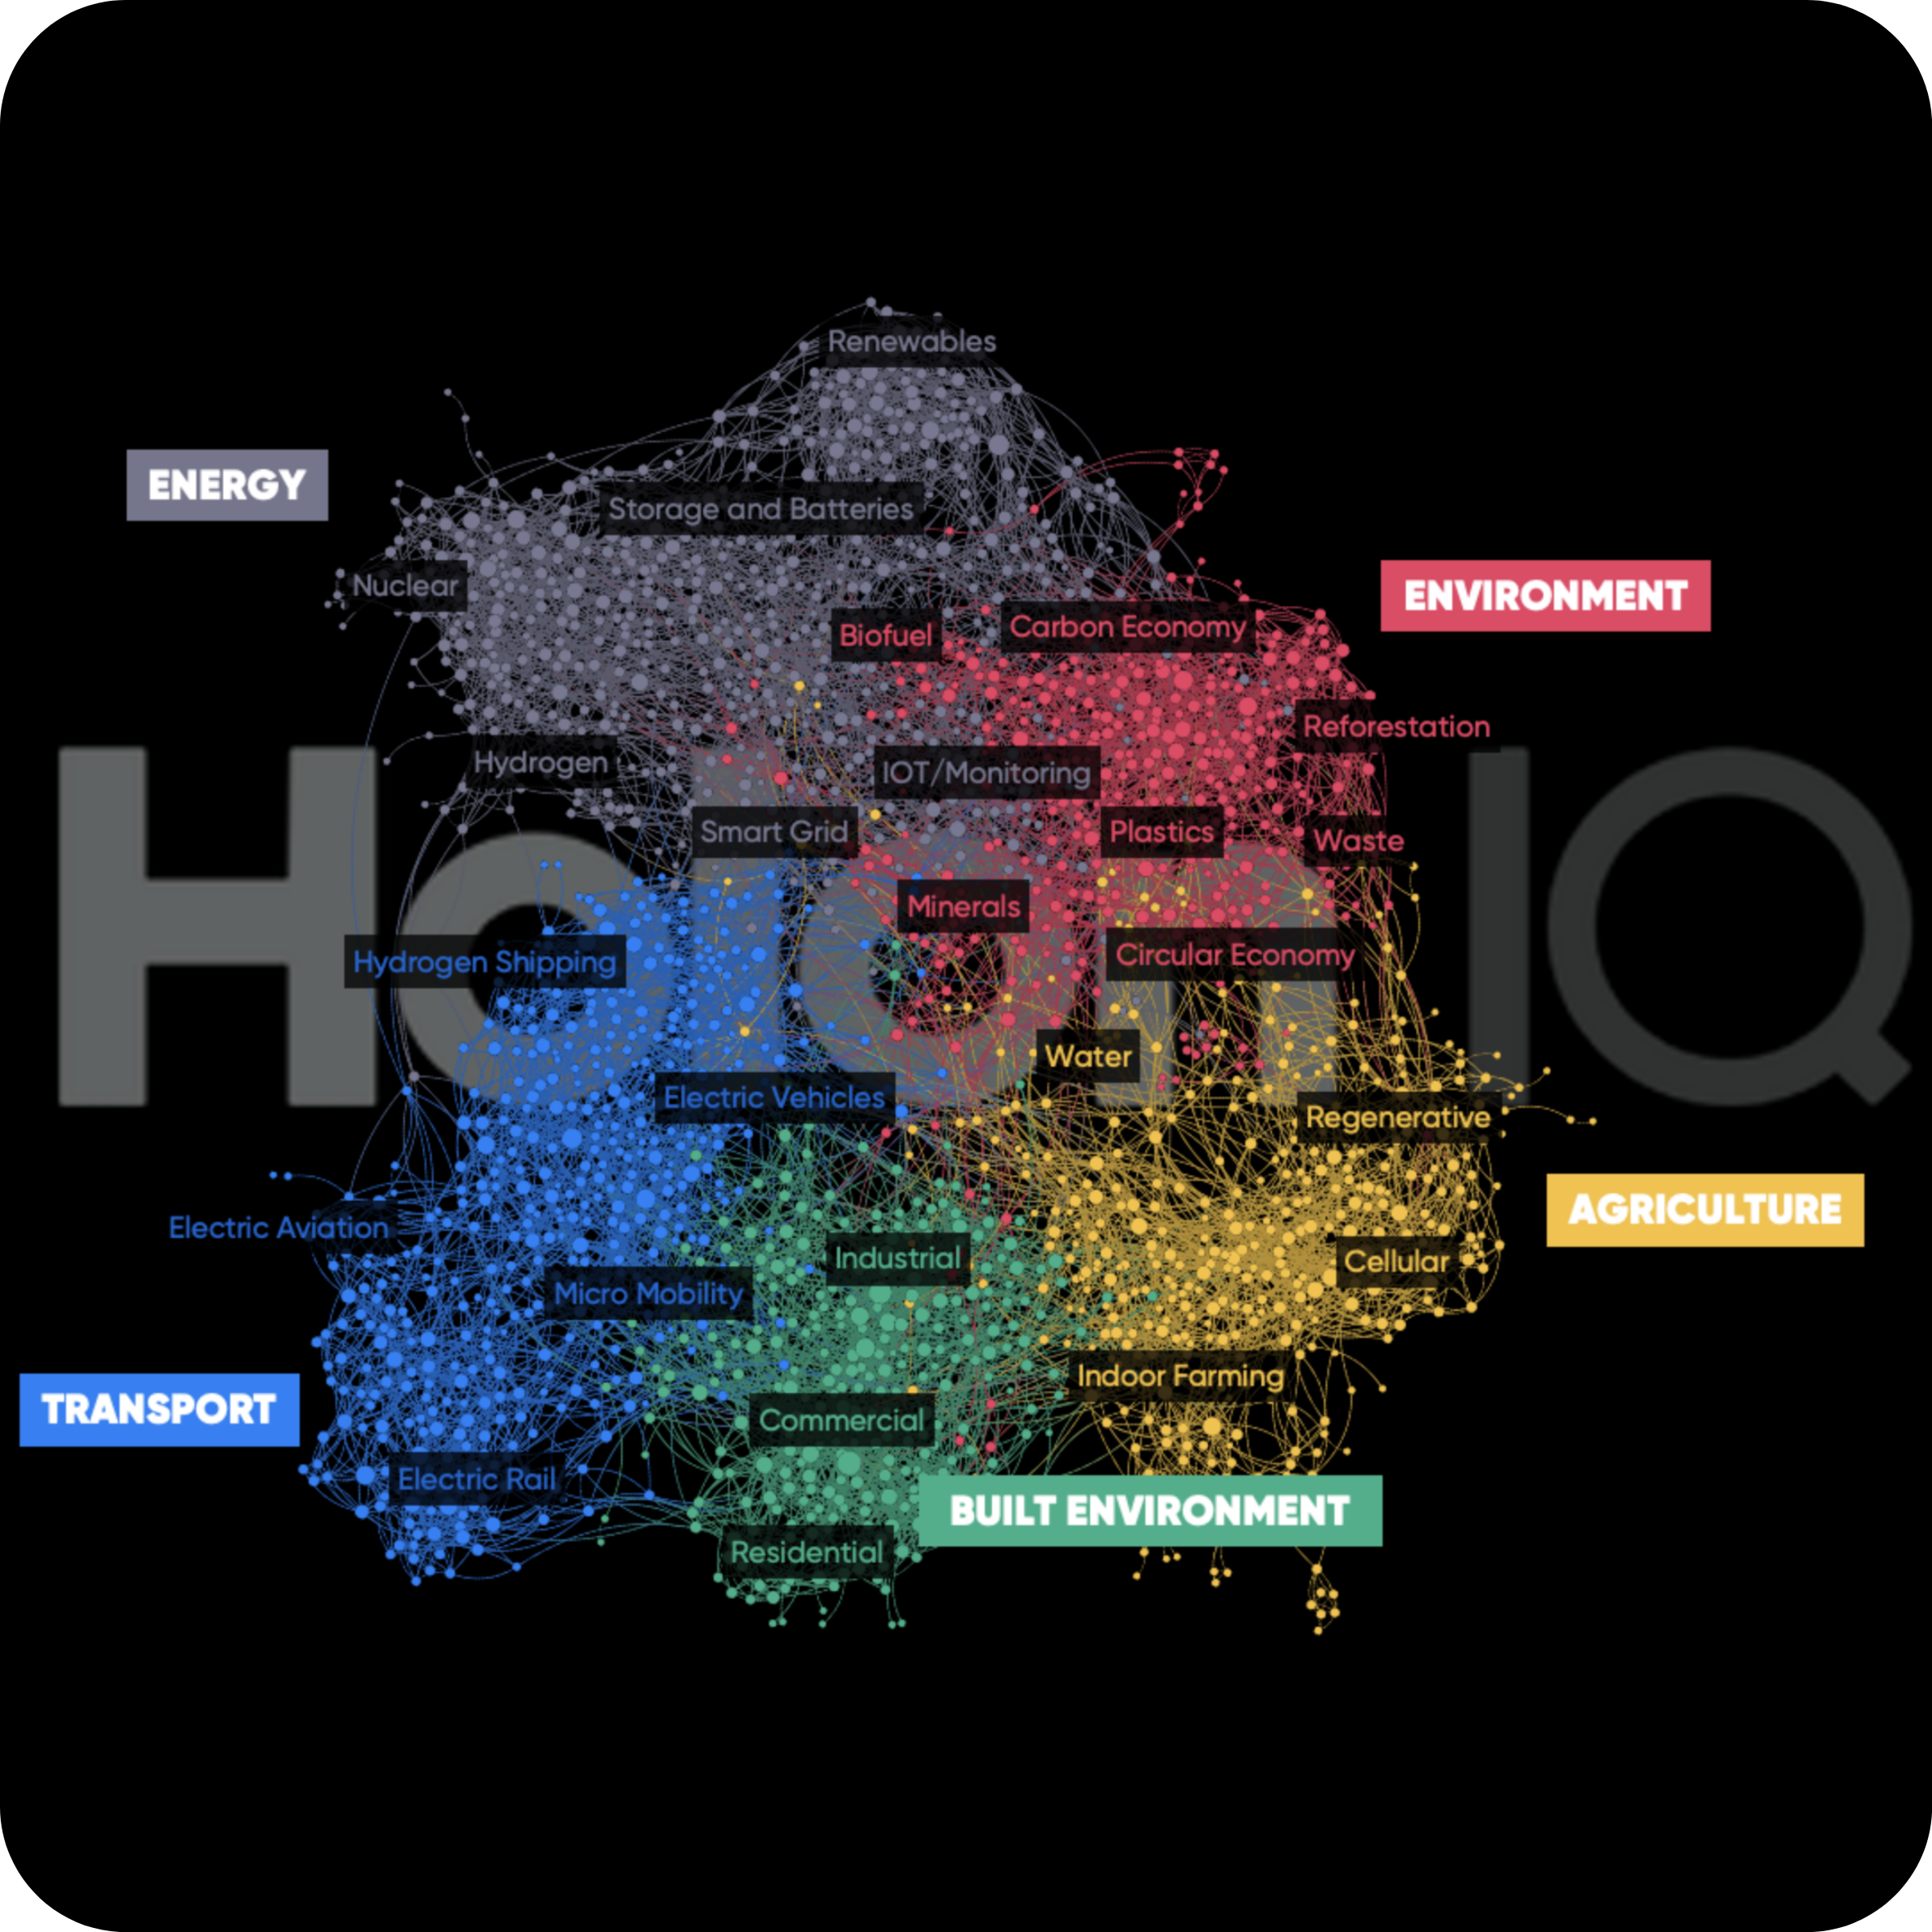
Understanding the ‘Alpha Prototype’
Networks are a powerful way to analyze and visualize complex relationships and help us better understand qualitative information like emerging technologies and business models.
Nodes & connections. Each node, or circle, represents an organization involved in climate innovation and technology. Connections represent a strong similarity between the organizations, indicating that they are using the same technology or business model or operating in a similar area.
Distance & orientation. Each node is like a charged particle that wants to repel all of the other nodes, and the links are springs that keep all of the particles from spreading too far away from each other. The more similarities between two organizations, the stronger the connections.
Clusters. A cluster is a set of organizations that group together, because many of them are connected due to similar technology, business models or operating in the same area of climate technology.
Network density. The more dense a cluster appears, the more similar its nodes are. Likewise, the more spread out a cluster appears, the broader its mix of nodes.
Bridging nodes and bridging clusters. Bridging nodes span across portions of the network and are often insightful. For example, it could indicate two mature technologies merging to tackle new problem. Similarly, bridging clusters help identify relationships and highlight gaps between specific applications and the core technologies.
Top Down - Human Expertise
HolonIQ’s Climate Intelligence Unit and our global network of experts from energy and the environment to agriculture, food and infrastructure bring deep expertise to our ‘top-down’ approach. The top-down analysis draws on the data-driven foundations of the bottom-up analysis to interpret patterns that the machine learning and artificial intelligence process produced. Considerations include context, history, purpose, business model, technologies and ecosystem relationships to add depth and interpretive understanding to the process. This also enables validation of findings against the models and innovations found in climate tech today or expected in the future.
Taxonomies are all about balance and trade-off's. Finding the right shape and structure to represent the spectrum of economic activities driving climate technology today, whilst leaving space to represent emerging technology with the potentially to drive accelerated adaptation and mitigation in the future.
Who we are
HolonIQ is the world’s leading platform for impact market intelligence. We power decisions that matter across education, healthcare and sustainability.
Our customers are governments, institutions, firms and investors who are shaping and influencing policy, innovation, technology and investment across the impact economy. In this constantly shifting landscape, our customers know that good decisions can’t be made without contextualised data, disciplined analysis and a global perspective.
We have developed open-source taxonomies and proprietary artificial intelligence to track these strategic developments around the world, as they happen.
Holon (ὅλον)
In systems theory, a Holon (ὅλον) is an evolving and self-organizing system. Each holon has integrity and identity on its own, but is simultaneously part of a larger system. We consider climate change and climate technology to be holonic systems, where holons (individual consumers and families, farmers and businesses, energy and resource giants to national governments) are simultaneously autonomous and co-operative.
Holonic systems are complex systems, efficient in the use of resources, highly resilient to disturbances yet adaptable to change, preserving the stability of a hierarchy while providing the dynamic flexibility of an adaptive system.
This is how we think about innovation in climate change. Not top-down, but rather innovating from within the system - constantly learning, cooperating and adapting. Enabled and empowered with new models that the network evolves and organizes around, maintaining a constant focus on sustainability.
Why we did this
Energy and the Environment, Agriculture and Infrastructure are all interconnected and complex systems, combining important social, economic, cultural, intellectual and personal factors and operating at global, national, local and personal levels. However, information and data about climate technology and the innovation that is occurring throughout the system is fragmented and anchored in its local environment, making cooperation across contexts difficult, thus hindering material innovation in the sector.
We have been building, investing and mapping innovation in the impact space for decades and have had the opportunity to work with entrepreneurs, academics, scientists, firms small and large and governments globally. One of the constant themes arising from our engagements and conversations with each of these stakeholders is the difficulty in accessing, understanding and learning from innovations undertaken elsewhere.
The Global Climate Tech Landscape provides common structure and language for identifying, tracking and making sense of the complexity and volume of innovation happening in sustainability all around the world by providing a well-defined, robust, accessible and community enabled taxonomy.
Using a common framework will support the discovery of, and access to innovation initiatives, provide opportunities for collaboration and benchmarking, reduce barriers to innovation and allow analysis and trend mapping within or across innovation clusters. Licenced under Creative Commons and as an open source project, the taxonomy is available for anyone to support their own work in education innovation.
Global Renewable Energy Generation
In the chart below we see the breakdown of renewable technologies by their individual components – hydropower, solar, wind, and others (geothermal and biomass). Globally we see that hydropower is by far the largest modern renewable source (excluding traditional biomass), and that wind and solar power are both growing rapidly.
Source. BP Statistical Review of World Energy
Global CO₂ emissions by fuel type
Carbon dioxide emissions associated with energy and industrial production come from a range of fuel types. The chart below shows the absolute and relative contribution of various CO2 emissions by source, differentiated between coal, gas, oil, flaring, and cement production.
Annual carbon dioxide (CO₂) emissions from different fuel types, measured in tonnes per year.
Source. Global Carbon Project (2020)
Food is responsible for approximately 26% of global GHG emissions.
Reducing emissions from food production is one of the greatest challenges in sustainability. Unlike energy, where viable alternatives such as renewable or nuclear energy are available, decarbonizing agriculture is much more complex.
Livestock & fisheries account for 31% of food emissions. Livestock raised for meat, dairy, eggs and seafood contribute to emissions in a number of ways from methane produced by cattle (through their digestive processes), manure and pasture management and fuel consumption from fishing vessels.
Crop production accounts for 27% of food emissions. 21% of food’s emissions comes from crop production for direct human consumption, and 6% comes from the production of animal feed. They are the direct emissions including elements such as the release of nitrous oxide from the application of fertilizers and manure; methane emissions from rice production; and carbon dioxide from agricultural machinery.
Land use accounts for 24% of food emissions. Land use for Livestock account for approx 16% of emissions and crops for human consumption approx 8%. Agricultural expansion results in the conversion of forests, grasslands and other carbon ‘sinks’ into cropland or pasture resulting in carbon dioxide emissions. ‘Land use’ is defined as the sum of land use change, savannah burning and organic soil cultivation (plowing and overturning of soils).
Supply chains account for 18% of food emissions. Food processing, transport, packaging and retail all require energy and resource inputs. Many assume that eating local is key to a low-carbon diet, however, transport emissions are often a very small percentage of food’s total emissions – only 6% globally. One-quarter of emissions (3.3 billion tonnes of CO2eq) from food production ends up as wastage either from supply chain losses or consumers. Durable packaging, refrigeration and food processing can all help to prevent food waste.
Global greenhouse gas emissions from food production
Source. Joseph Poore & Thomas Nemeck (2018). Reducing food's environmental impacts through producers and consumers.
One third of the worlds forests have been lost. Half of this occurred in the last century.
71% of the earths surface are Oceans, leaving 10% covered by glaciers and a further 19% as barren land – deserts, dry salt flats, beaches, sand dunes, and exposed rocks. This leaves what we call ‘habitable land’.
Forests account for a little over one-third (38%) of habitable land area. This is around one-quarter (26%) of total (both habitable and uninhabitable) land area. This marks a significant change from the past: global forest area has reduced significantly due to the expansion of agriculture. Today half of global habitable land is used for farming. The area used for livestock farming in particular is equal in area to the world’s forests.
Sources. UN Food and Agriculture Organization (FAO), Williams, M (2003). Deforesting the earth: from pre-history to global crisis.